About a year ago, some of our internal telemetry systems were occasionally experiencing a significant backlog in their delivery to the central collection endpoint. This would typically last for hours and then recover.
Some additional details for those who are unfamiliar with this issue:
The connections in question are very long-lived (weeks to months).
This only occurred in some APAC PoPs with less connectivity to our backbone.
While the degradation might take months to occur, once the backlog started, it would tend to re-occur at least once a week.
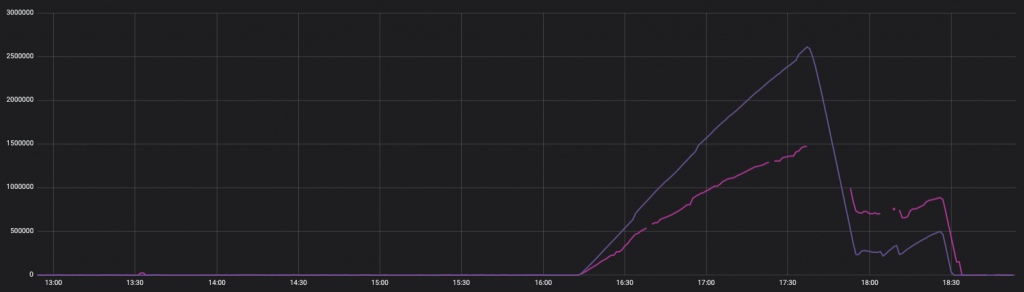
The two lines above represent the backlog to two separate send
Some observations
We need to collect some data informed by hypotheses as well to form new hypotheses.
A drop in transmits from the NOC box
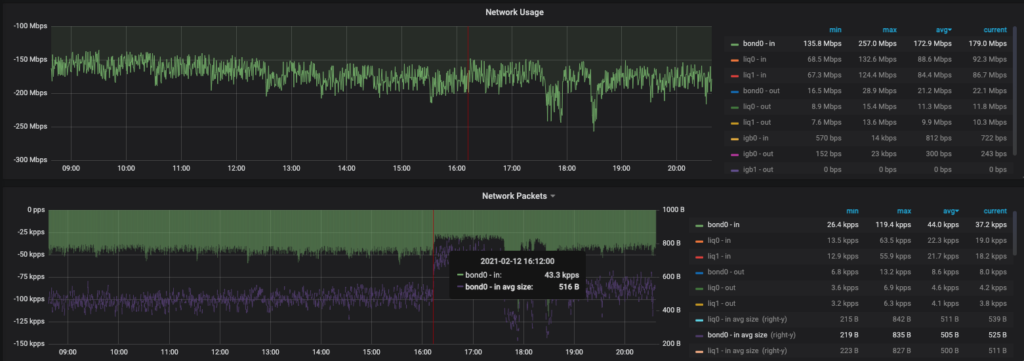
One initial hypothesis was that the sending boxes were somehow saturating their links and that the source of the backlog was simply an inability of the network interfaces to transmit fast enough. But that’s not what was observed during the backlog; instead, the network traffic dropped and then increased (corresponding to finally being able to drain the backlog).
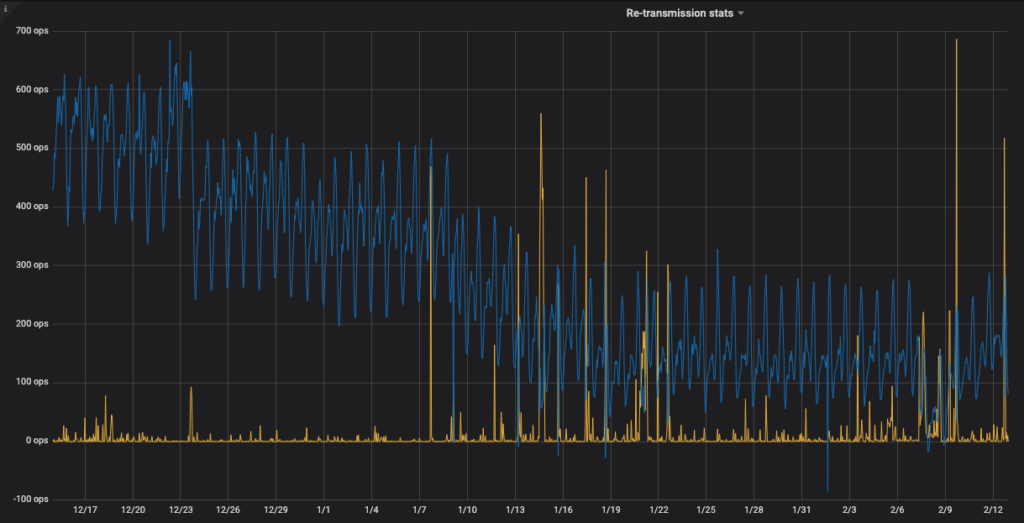
An increase in re-transmits
As it was clear that the network wasn’t even close to being saturated, we are left to seek a reason why the machines could not send at a decent bandwidth. After poking around a bit, the first helpful observation was that all boxes on the sending side would see a sudden, prolonged increase in lost packets and re-transmits. One example of this can be seen below. As essentially this same graph was seen on each of the senders, this would appear to point to network issues external to the machines. Lots of re-transmits will undoubtedly lead to poor bandwidth.
The receiver notices… sort of
Looking at the receiver side, we found another surprising puzzle piece. While the total ingressbandwidth was virtually unchanged (the POP in question is relatively small), the ingress packet rate had a massive chunk taken out of it.
Weirdly small packets
Now, at this point, this seems a bit nuts. The only real explanation is that the sender in question sends a smaller (or similar) amount of bits but in smaller packets.
If we look back at one of the sender hosts, we can see that the average sent packet is ~500 bytes, whereas you would expect it to be closer to 1200–1300. This indicates some confirmation that the site was sending smaller packets than usual.
Following this track further, my mind was blown to see that our Kentik data confirmed that the backlogging location was responsible for 70% of all packets sent to the collection systems, representing a much smaller percentage of bits. The two sending servers are the large blue and yellow donut pieces.
Time for some confirmatory packet captures
I took a brief packet capture from one of the sending machines and compared it with another sender in the region. Below, you can see that most packets coming out of the “good” server are either zero bytes (e.g., just an ACK) or full-size 1448 or 2896 (offloaded). But, our problem child is struggling to send anything over one thousand, with the largest individual size being 504 or 540 bytes. This is again in line with the graphs from above, but it’s nice to see it in practice.
So, we know that we’re sending small packets, but why? I was stumped and consulted one of our networking experts, who offered some possibilities:
Nagle’s was possibly being disabled for some reason by the sending software.
A router might be sending ICMP please fragment messages while we had a DF (do not fragment) set and needed to send small packets.
This was part of the Linux kernel’s black hole detection. In essence, if it notices packets don’t seem to be arriving, it will start reducing the sending size to get through the box that is dropping large packets.
I could eliminate the first possibility by confirming that nowhere in the code was any attempt made to disable Nagle’s. The second and third possibilities required a bit of investigation.
Small MSS
Evidence was gathered supporting at least some form of Path MTU changes, either explicitly or through the black hole detection.
What immediately stood out is that the MSS (the maximum size we will attempt to send) value for many of the connections was relatively low. As in, freakishly low.
Your eyes are not deceiving you, some of those values are 36. But range is up to 1152. These specific values become interesting later.
If you take a weighted average of those MSS values, you arrive at around 436, which is at least around the 500 bytes that we were seeing as an average.
Comparing this with other PoPs in the region, it becomes clear that these values are not the norm merely due to the distance from our central locations. Below are the values from two “good” locations in the APAC region. Note the value of 1024, which becomes important later.
Recall that one of the hypotheses was that perhaps we were receiving ICMP messages indicating we should reduce our packet size. An experiment was run to restart a bean counter and watch for a decrease in MSS, while also checking for ICMP messages indicating that the MTU needs to lower. Long story short, not a single code 4 ICMP packet was received, while it was quickly observed that the MSS changed for the new connections.
Black hole probing/Path MTU discovery
This leaves us with Path MTU discovery that isn’t tied to ICMP messages. What might that look like? As part of the above experiment, TCP connection data was obtained between one of the “bad” senders and the receiver over a long period of time. Essentially, the socket stats were collected and timestamped. Most connections quickly landed at 1024-byte MSS (from a starting point of 1448), with one arriving at 1152. Those are the values coming back to us.
My first reaction upon seeing the value of 1152 was that it must be a case of a pretty good connection, while the ones at 1024 had a worse connection. And I guess this was kind of true; but looking into the details reveals a fun path.
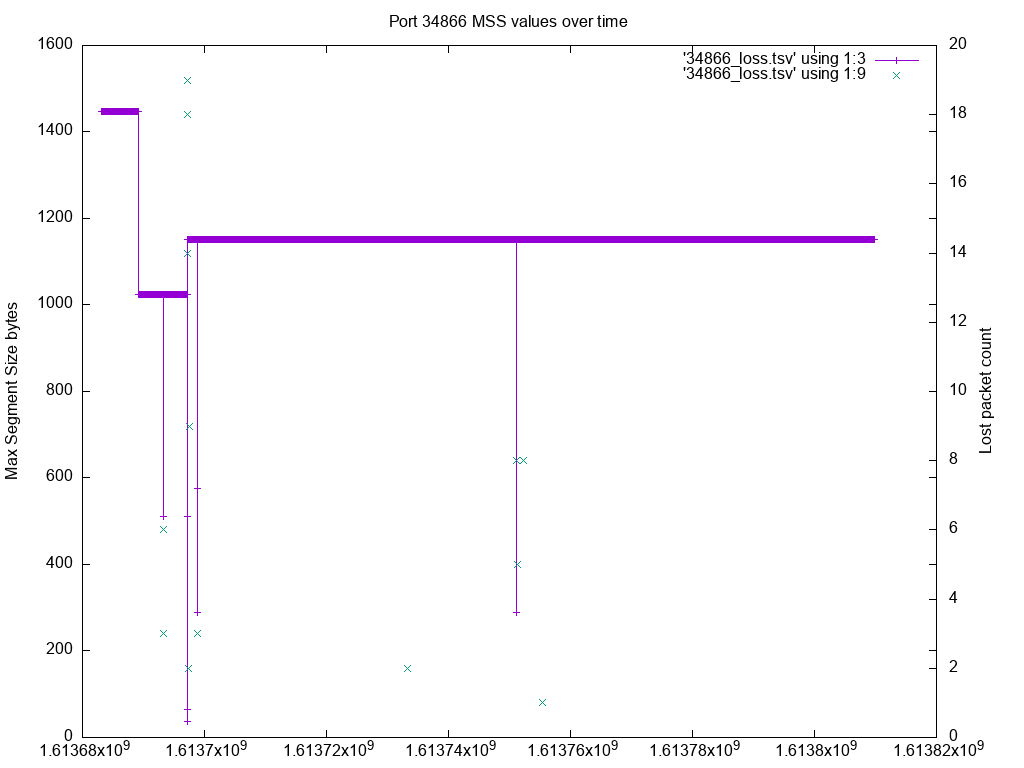
So, note that the MSS of 1152 corresponds to a connection from ephemeral port 34866. Looking at just the data for that connection:
Well, that’s interesting. This connection, which is currently at 1152 for an MSS, spent some time as a much smaller (even the ridiculous 36). However, the foray into those smaller ones was quite brief.
But this at least seems to tell us that some probing was happening.
Visually:
But it seems to be stuck
While this investigation has led to some answers (hey, seems to be MTU discovery), it is supposed to land on the right value, isn’t it? Apparently not. Now that I knew what was being experienced, I could search a bit for what others were saying. Fellow CDNs have noted that there is a tendency for long-running connections to arrive at small MSS values and, in fact, Akamai even submitted patches to later kernels, which puts a floor on the probing. But (at least in my searches), nobody was saying why this happens, and Akamai’s patch was felt to be a workaround.
But MTU probing is not without its own issues. First, it tends to miscategorize congestion-related packet loss as MTU issues. Long running connections tend to end up with a reduced MTU.
The current implementation of TCP MTU probing can considerably underestimate the MTU on lossy connections allowing the MSS to get down to 48. We have found that in almost all of these cases on our networks these paths can handle much larger MTUs meaning the connections are being artificially limited. Even though TCP MTU probing can raise the MSS back up we have seen this not to be the case causing connections to be “stuck” with an MSS of 48 when heavy loss is present.
Once again, they hint that long-running connections seem to get “stuck” with a small MSS (they even note a value of 48).
Yes, but why?
Moving toward that hypothesis
So, from the above, we find ourselves having servers in various states of MSS with < 1448 packets, which they can’t seem to exit out of despite a mechanism that exists to probe.
We have a couple of things to explain:
Why do some connections go through a few very specific MSS values (36, 144, 288, 576, 1024, 1152, etc.)?
Why do connections appear to “stick” at a particular value that we know is lower than what the path can handle?
I’m also going to reveal one additional piece of information for those following along (I certainly had no idea it was important until much later):
The systems in question were running Linux kernel 3.10, the default for CentOS 7.
A trip into Linux Path MTU discovery
Let’s start looking at the actual code that handles probing (there isn’t much, I swear!).
tcp_mtu_probe
static int tcp_mtu_probe(struct sock *sk)
{
  ...
  int probe_size;
  int size_needed;
  int copy;
  int mss_now;
  /* Not currently probing/verifying,
  * not in recovery,
  * have enough cwnd, and
  * not SACKing (the variable headers throw things off) */
  if (!icsk->icsk_mtup.enabled ||
    icsk->icsk_mtup.probe_size ||
    inet_csk(sk)->icsk_ca_state != TCP_CA_Open ||
    tp->snd_cwnd < 11 ||
    tp->rx_opt.num_sacks || tp->rx_opt.dsack)
    return -1;
  /* Very simple search strategy: just double the MSS. */
  mss_now = tcp_current_mss(sk);
  probe_size = 2 * tp->mss_cache;
  size_needed = probe_size + (tp->reordering + 1) * tp->mss_cache;
  if (probe_size > tcp_mtu_to_mss(sk, icsk->icsk_mtup.search_high)) {
  /* TODO: set timer for probe_converge_event */
  return -1;
  }
  ...
  // send probe
  icsk->icsk_mtup.probe_size = tcp_mss_to_mtu(sk, nskb->len);
  tp->mtu_probe.probe_seq_start = TCP_SKB_CB(nskb)->seq;
  tp->mtu_probe.probe_seq_end = TCP_SKB_CB(nskb)->end_seq;
Ok, so we look here, and we see that it will double the current MSS; that seems promising! This means we should be able to arrive at a sane value.
The doubling seems to clearly explain that we see values like 144, 288, and 576 in succession. But where do 1024 and 512 come into this?
1024 is the recommended default value for the base_mss:
net.ipv4.tcp_base_mss = 1024
When do we actually probe?
static bool tcp_write_xmit(struct sock *sk, unsigned int mss_now, int nonagle,
int push_one, gfp_t gfp)
{
  ...
  if (!push_one) {
    /* Do MTU probing. */
    result = tcp_mtu_probe(sk);
Basically, we can all the time. Any time we go to send packets (other than the particular push_one case), the stack will attempt to probe if it can. In nearly all cases, it won’t perform the probe because the MSS will already be at its best value (sidebar: does this indicate a potential optimization? Should that call be inside a conditional that checks whether MSS is already at the dst_mtu?).
Ah ha, so it sets our search_low value (as described in the Path MTU RFC). The search_high value amounts to being 1448 + (some stuff) and represents the highest MTU we expect that we could support. This value becomes important later.
“search_low”?
So, base_mss feeds into search_low. But how is that used?
tcp_mtu_probing
static void tcp_mtu_probing(struct inet_connection_sock *icsk, struct sock *sk)
{
  /* Black hole detection */
  if (sysctl_tcp_mtu_probing) {
    if (!icsk->icsk_mtup.enabled) {
    icsk->icsk_mtup.enabled = 1;
    tcp_sync_mss(sk, icsk->icsk_pmtu_cookie);
  } else {
    struct tcp_sock *tp = tcp_sk(sk);
    int mss;
  // jdewald This is where we take the last successful probe value
  // and cut it in half to start our probe with
    mss = tcp_mtu_to_mss(sk, icsk->icsk_mtup.search_low) >> 1;
    mss = min(sysctl_tcp_base_mss, mss);
    mss = max(mss, 68 - tp->tcp_header_len);
    icsk->icsk_mtup.search_low = tcp_mss_to_mtu(sk, mss);
    tcp_sync_mss(sk, icsk->icsk_pmtu_cookie);
    }
  }
}
Well, hot diggity, we’ve arrived at code that starts black hole detection. And there is a very important line in there:
So, the first time that block of code fires, it would take search_low (1024) and cut it in half (512). Also, note that this is split in half only the second time. The first time, it simply enables the probing to occur. Refer to the "tcp_mtu_probe" method, which performs a check against enabled.
But let’s not ignore that innocuous call to tcp_sync_mss.
unsigned int tcp_sync_mss(struct sock *sk, u32 pmtu)
{
  ...
  int mss_now;
  if (icsk->icsk_mtup.search_high > pmtu)
    icsk->icsk_mtup.search_high = pmtu;
  mss_now = tcp_mtu_to_mss(sk, pmtu);
  mss_now = tcp_bound_to_half_wnd(tp, mss_now);
  /* And store cached results */
  icsk->icsk_pmtu_cookie = pmtu;
  if (icsk->icsk_mtup.enabled)
    mss_now = min(mss_now, tcp_mtu_to_mss(sk, icsk->icsk_mtup.search_low));
  tp->mss_cache = mss_now;
  return mss_now;
}
Well, hey, it’s our friend search_low coming into play after an “enabled” check.
Since 1024 < 1448, this means that mss_cache (and mss_now, for those looking at the return value of this function) will be 1024.
Recall from above that we had connections that seem to be stuck at 1024. We at least have a specific location in code that gets us there. We need tcp_mtu_probing triggered to set the “enabled” flag to true. We’ll explore later why it gets “stuck” at 1024 (but hey, at least it’s not 36!).
When does MSS reduction occur via tcp_mtu_probing?
So, it turns out that tcp_mtu_probing is called when there is a write timeout, and we’ve already tried re-transmitting. This is potentially a “black hole” (perhaps for obvious reasons).
static int tcp_write_timeout(struct sock *sk)
{
  ...
  ...
  if (retransmits_timed_out(sk, sysctl_tcp_retries1, 0, 0)) {
    /* Black hole detection */
    tcp_mtu_probing(icsk, sk);
Some stuff explained
So, to summarize where we are now:
MSS starts at some negotiated value (let’s assume it’s 1448 since that’s what it usually is).
A write timeout occurs, as well as re-transmission failure.
MSS is reduced to the value of search_low = mss_base = 1024 to work around potentially missing ICMP messages.
We’ve also seen the code that would lead to values of 512, 256, etc., so we can add that:
another write timeout occurs, which cuts MSS in half again (say, to 512, or from there to 256).
But what we still need to answer is:
Why can MSS sometimes get out of a low value but sometimes not?
Why does it get stuck, and why at different values?
Explaining “stuck” values
Stuck values generally turn out to be reasonably easy to explain.
1024
First, 1024 (our base MSS).
Recall this little chunk in :
if (probe_size > tcp_mtu_to_mss(sk, icsk->icsk_mtup.search_high)) {
      /* TODO: set timer for probe_converge_event */
      return -1;
  }
And, what is search_high (after conversion back to MSS) when we’re still in good shape at initialization? The answer: 1448.
What is 1024 * 2? The answer: 2048.
In other words, if we have had a single-loss event, which triggers black holedetection, we will get stuck at an MSS of 1024.
1152
Naturally, you will ask (as I know I did): if 1152 is greater than 1024, and you said it gets stuck at 1024, what’s happening here?
Fascinatingly, we arrive at a better MSS of 1152 when conditions are at some point worse than they were for the 1024 case!
So, 1152 doesn’t seem related to 1024 when we think about powers. But, through a somewhat circuitous route, we can get there.
Let’s propose that we are in a situation where we have a lot of retransmissions and timeouts. Nothing is getting through. What might happen in that situation?
Well, what I think would happen is that we will keep calling tcp_mtu_probing, which halves and halves and halves the MSS: 1024, 512, 256, 128, 64, 32.
Recall that we saw those values when we looked at the MSS values for this connection. But we didn’t see 32. We instead saw 36. I don’t yet have an explanation for that value, as 48 is supposed to be the lowest. But in any case, I’m certain that once we hit this block:
mss = max(mss, 68 - tp->tcp_header_len);
And MSS drops below 36; it gets reset to 36, indicating that tcp_header_len here is 32 bytes, rather than 20. So, we can’t go lower than that.
What happens once the connection isn’t losing packets left and right? Well, we start executing tcp_mtu_probe, which does the *2 operation:
So, we now have an explanation for each of the specific values.
Sheer lousy luck: explaining anything lower than 1024 or 1152
At last, we get to the heart of the matter. Getting stuck at 1024 or 1152 isn’t so bad, as it’s only 30% off a good value. But how do we get stuck at values lower?
One bit of code that I haven’t yet gone over is arguably the essential part of the path of MTU discovery: flagging an MSS as being too high so that we shouldn’t go over it. The discovery part of the process; how does that happen?
There are two tiny little methods (note that some lines were removed that were irrelevant to the discussion).
This gets called in tcp_clean_rtx_queue, which takes packets out of the re-transmit queue that has been acknowledged.
if (flag & FLAG_ACKED) {
  if (unlikely(icsk->icsk_mtup.probe_size &&
      !after(tp->mtu_probe.probe_seq_end, tp->snd_una))) {
    tcp_mtup_probe_success(sk);
  }
Basically, “if we have a probe outstanding and the first unacknowledged byte is after the end of the probe packet, mark the probe as successful.”
Recall that search_low feeds into tcp_sync_mss. So, what this is saying is, “we seem to have found an MSS value that works, so we can start there any time we want to probe upwards. We are pretty sure we can handle it moving forward.”
So, when a probe fails, we say “’probe_size’ was too big, but we may be ok up to that” (e.g., if the probe was 1024 bytes, we will only try to send packets up to 1023 bytes during later probes).
It is called in tcp_fasttrans_alert (which I still haven’t fully traced, but it deals with various ACK/SACK/loss situations).
/* MTU probe failure: don't reduce cwnd */
if (icsk->icsk_ca_state < TCP_CA_CWR &&
icsk->icsk_mtup.probe_size &&
tp->snd_una == tp->mtu_probe.probe_seq_start) {
  tcp_mtup_probe_failed(sk);
The thing not to ignore here is the TCP_CA_CWR which is a requirement of the RFC Path MTU discovery that just means “don’t mark a probe as failed if we are in a situation where we seem to be having a ton of packet loss or other congestion events.”
The actual check amounts to “mark probe failed if the first unacknowledged packet is the start of our probe.” Essentially, the inverse of the “success” check. But the more important part, which happens before the check, is that we’ll only be here if we have selective ACKs (SACKs); “hey, I got some packets after this other one, but I didn’t seem to get this one, there’s a hole.” Our probe is assumed to be the start of that hole.
Back to those small values
Let’s say we have had some timeouts that reduce our MSS to 512 (recall from above why that might happen).
We recover from the congestion and are now in a “clean” state (state = open), so we successfully send a probe via tcp_mtu_probe. Since MSS was 512, the probe will be 1024 bytes.
That probe is lost through an unfortunate event, but the 512-byte packets that follow are acknowledged just fine.
This causes us to go into tcp_mtu_probe_failed, where we mark 1024 as too big (so we set search_high = 1024−1 = 1023) and clear the probe. MSS remains at 512.
We re-transmit the packet and are back off to the races, then try to probe again. We again double 512 to 1024.
Except we run into our now-familiar nemesis:
if (probe_size > tcp_mtu_to_mss(sk, icsk->icsk_mtup.search_high)) {
Oh no, 1024 > 1023, so we can’t probe!
And so, we’re stuck at 512.
We can apply this same thing down to a value of 36.
If we’re at an MSS of 512 and have a series of re-transmission timeouts, we reduce MSS to 256.
We then clear up and get unlucky enough to halve our probe fail, search_high gets set to 511, and we’re stuck at 256.
And so on.
But that seems unlikely!
I agree. But that’s why gradually reducing this can take weeks or even months. It also requires a location that has bursts of timeouts and congestion. Having a large Bandwidth Delay Product (and therefore CWND) helps, too, so you have more packets out to get lost.
Connections lasting weeks or months – (these telemetry connections are very, very long-lived).
Bursts of congestion/transmits – the bad PoPs connection (unnamed global transit provider) over to the US can be bad.
Large BDP – 200–300ms RTT leaves a lot of room for packets over the wire.
But I’m not sure it’s as unlikely as we’d think because the only time we’re going to have our MSS drop is during times of packet loss. So, if a probe happens shortly after we think we’re out of that, it’s not insane to believe that the probe packet would be lost shortly following recovery.
Below, you can see the average packet size coming out of the problem PoP over two months, overlaid with re-transmission rates.
You can see that the average packet size is relatively stable until it decreases during periods of re-transmission, for the most part getting stuck (in hindsight, this graph sort of says it all!).
In summary
Conditions in the bad PoP are such that there are enough bursts of loss over time to create two situations:
A decrease in MSS due to re-transmission timeouts.
Random variation in loss such that we very unluckily lose probe packets, which results in us getting “stuck,” sometimes at absurd values.
After all of the above, I don’t think that what the kernel is doing is a bug. It’s working exactly as specified in the RFC. With my hypothesis, it is still correctly marking probes as having failed when they are the only thing lost (or, at least, that they are the start of a whole). The problem is that, due to the law of large numbers, we occasionally get unlucky enough that random loss looks precisely like the inability to deliver large packets.
Regarding the actual reported issue (telemetry backlog from a specific region), I believe the source is that once we reach the point where we have small MSS, our connection has become very inefficient, and we always have a lot of outstanding packets. Once we get into a congestion/loss situation, we quickly can’t make any progress on getting data out, as the number of queued packets goes through the roof and worsens as we deal with the re-transmissions. Once we recover from that, we can get back to limping along.
Solutions
Spoiler alert: an upgrade to any kernel past 4.1 resolves this issue.
As noted, Akamai (and even Google) have put in some workarounds in newer kernels, which lets you set the floor for MTU probing to at least try to prevent it from getting too low. If we upgrade, we will get that.
One whacky idea was that, during the probe process, we could take a low-probability chance of ignoring the search_high check. This would let us slowly inch our way back toward a value that was a known good. This could even be one billion (I haven’t done the math).
Another idea was that the kernel should occasionally “reset” the MTU/MSS probing back to the negotiated value, essentially calling tcp_mtup_init periodically. I think it could even be as infrequently as once a day so that we don’t thrash too much on short-lived connections that legitimately have Path MTU issues. This is not much different than what the probe process is already doing by sending too big packets.
This is essentially what was introduced in kernel 4.1, in the form of the tcp_probe_interval value, which defaults to 10 minutes.
From RFC 4821 (from 2007; so it was simply ignored up until kernel 4.1 in 2015):
Each Packetization Layer MUST determine when probing has converged, that is, when the probe size range is small enough, further probing is no longer worth its cost. When probing has converged, a timer SHOULD be set. When the timer expires, search_high should be reset to its initial value (described above) so that probing can resume. Thus, if the path changes, increasing the Path MTU, the flow will eventually take advantage of it. The value for this timer MUST NOT be less than 5 minutes and is recommended to be 10 minutes, per RFC 1981.
Another solution would have been to simply disable MTU probing on machines where the network path is known (e.g., there is no router in the path that isn’t going to accept full-sized segments).
Appendix
A simulation
I’ve created a Jupyter notebook, which attempts to show the above in action. When exported, it demonstrates getting stuck at 512 and showing a reduction to 288.
We can see here that our mss_cache is now 1024 (BASE_MSS), but other values are otherwise the same.
Now, let’s send out a probe and have it succeed.
tcp_mtu_probe(sock_opts)
sock_opts

if sock_opts['probe']['probe_size'] > 0:
    tcp_mtup_probe_success(sock_opts)
    sock_opts
(tcp_mtu_probe) mss_now: 1024, probe_size: 2048
    	(tcp_mtu_probe) not probing because probe_size is too high
If you note the output, we see “not probing because ‘probe_size’ too high.” This is because it will try 2048, which is greater than 1448. So, we need another loss before we can start probing.
Great. As expected, “mss_cache” is now 1024, and our “cwnd” has reduced to account for the change (e.g., the total outstanding data would be the same, but since it had “mss_cache” of 512 previously, it needed to go down. This part is contrived since we didn’t go through “cwnd” changes.
But now, let’s do it again. This time the probe will fail.
So, mss_cache is back to 512, and cwnd has gone up. But, check out search_high, which is now 1055 (previously, it was 1480). What happens if we try to probe again?
tcp_mtu_probe(sock_opts)
sock_opts
(tcp_mtu_probe) mss_now: 512, probe_size: 1024
    	(tcp_mtu_probe) not probing because probe_size too high
{'mss_cache': 512,
     'cwnd': 51,
     'ssthresh': 1,
     'state': 'open',
     'probe': {'enabled': True,
      'search_high': 1055,
      'search_low': 544,
      'probe_opts': 0,
      'pmtu_cookie': 1480,
      'probe_size': 0}}
We couldn’t probe because search_high is 1055, which translates to 1023, which is < 1024.
tcp_mtu_to_mss(1055)
1023
Ok, so now we get into a terrible situation where we have a bunch of loss, and our MSS drops a couple of times: