We just launched a new feature that allows you to easily drill deep into your stats to understand what makes up anomalies. This traffic reporting is now available in every StackPath SecureCDN plan. Here we will show you how to identify and attribute anomalies in your traffic so that you can make informed decisions on how to optimize performance for your website or app.
Getting Started (with SecureCDN)
Let’s say your site utilizes StackPath SecureCDN. You’re reviewing your stats and notice a figure incongruent with a typical month’s activity. This might be a noticeable dip, spike, or flatlining of traffic or response codes. Here’s how to take a closer look:
Log in to your account. (If you don’t have an account, get one.)
Go to Dashboard > Sites > Manage and choose the site you’d like to use.
Click any data point on graph with magnifying glass.
Click any event aggregation to see the relevant raw logs
Let’s say you notice a spike in 4xx status codes that happened a few hours ago. You can quickly determine the significance of this event by looking at the aggregated data and comparing data points to investigate the root cause.
Raw Logs
Once you click on any of the aggregated numbers you will be redirected to our raw log viewer where you can find all individual requests filtered by date, time and status type.
As you can see in our case the spike in 4xx requests was due to an increase in 404 errors. It appears that GoogleBot was trying to access pages that don’t exist.
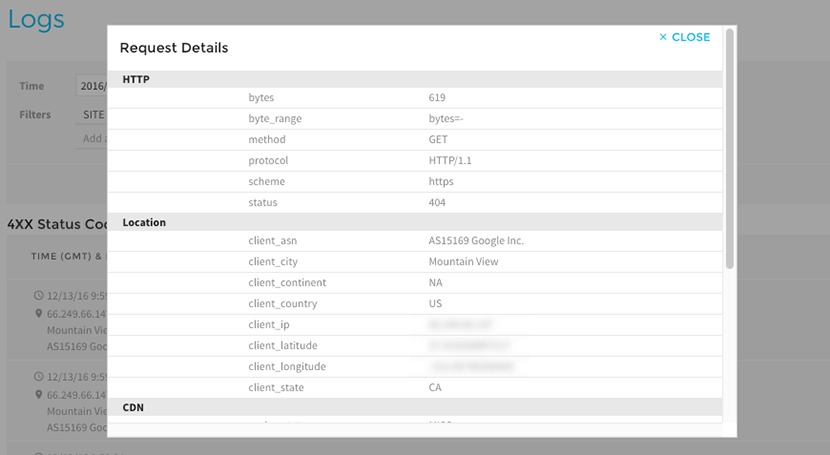
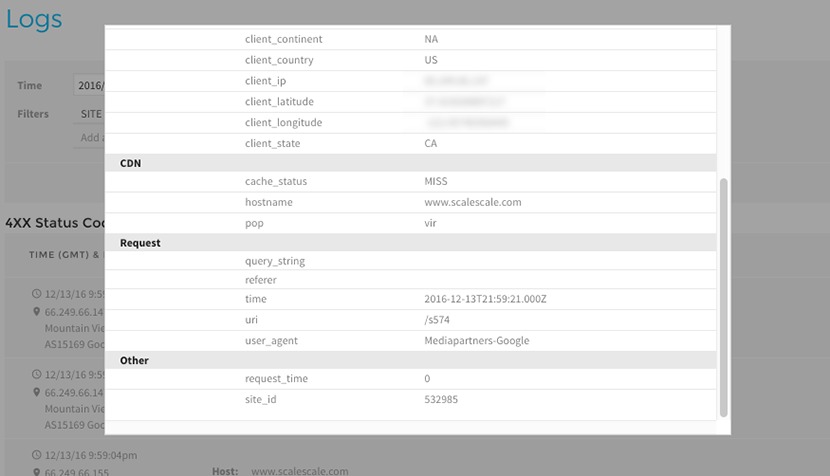
You can click on any record to see the full request details.
By taking a deeper look into the status codes from these individual requests, we can confirm that it is indeed GoogleBot causing the anomaly in traffic. In this case the anomaly is 404 codes (Page Not Found) and these errors mean that Google’s automated crawler wasn’t able to find some of the pages it was looking for. As you are probably already aware, these are most likely the result of missing, moved, or improperly linked content on your site and fixing these can improve the overall user experience and traffic quality of your visitors.
We hope you love the feature and it keeps your sites running very smoothly.